
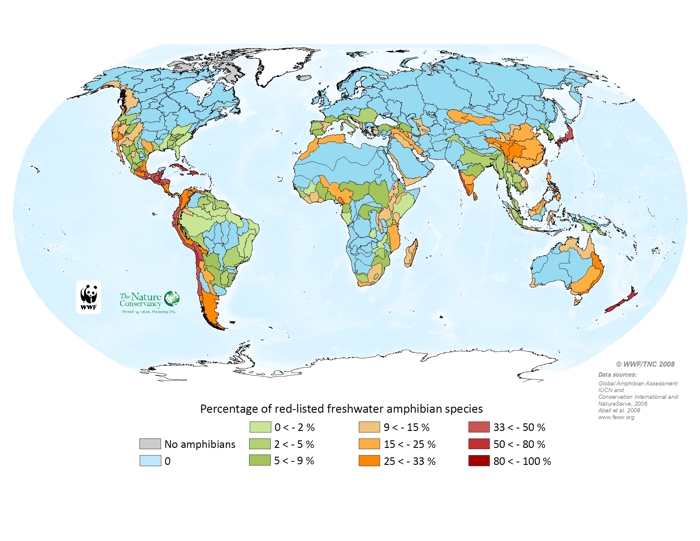
The map of percentage threatened freshwater amphibians – the number of freshwater amphibian species per ecoregion that are threatened with extinction according to the IUCN Red List, divided by the total number of freshwater amphibian species in the ecoregion - was generated using data from the Global Amphibian Assessment (GAA) (IUCN, Conservation International, and NatureServe, 2006). The GAA assessed the conservation status of 5,918 amphibian species, of which 4,035 depend on fresh water during some stage of their life cycle. Strictly arboreal species that do not require fresh water for their larval stage, species that develop directly from eggs without a larval stage, as well as few live-bearing species are excluded from this analysis.
Threatened species refer to those listed by the IUCN Red List as Vulnerable, Endangered, or Critically Endangered. The IUCN Red List is the leading authority on the conservation status of plants and animals. As of 2006, of the 4,035 freshwater-dependent amphibians, 1,356 species are classified as threatened.
Overall, more than a third of all amphibians (32.2%) are threatened with extinction, a higher rate than birds (12%) and mammals (23%). These numbers do not include already extinct species. There are a total of 34 confirmed amphibian extinctions, 9 of which have occurred since 1980. But there are many more species that have not been seen in years and could be extinct, including 113 species from all over the world that have not been seen since 1980. In addition, for 1,427 species there was insufficient data to assess their conservation status and are classified by the GAA as \"data deficient.\" Therefore, these estimates are conservative.
As with the amphibian richness and endemism, species distribution maps were used to determine the number of threatened amphibians per ecoregion. When a range overlapped several ecoregions, species were counted as present in all those ecoregions that had part of the range. Some ecoregions with long and narrow shape may have an overestimation of species given the way the range polygons were drawn. This is particularly true the Amazonas High Andes ecoregion (312), where the mountain range has been used as a range boundary for hundreds of species.
Distribution maps from the GAA represent the Extent of Occurrence for each species— that is, the area contained within the shortest continuous imaginary boundary, which can be drawn to encompass all the known, inferred or projected sites of present occurrence of a taxon. A species\' distribution map can consist of more than one polygon where there is an obvious discontinuity in suitable habitat. Because of the conservative approach taken in the GAA to mapping species, the ranges for many species are likely to be minimum estimates. A rule was followed allowing interpolation of occurrence between known locations if the ecological conditions seem appropriate, but not permitting extrapolation beyond known locations. Some species are therefore almost certain to occur much more widely than has been mapped. Because of this, some regions are recorded as having much lower numbers. Please refer to the GAA for more detailed information on the data (http://www.globalamphibians.org/).