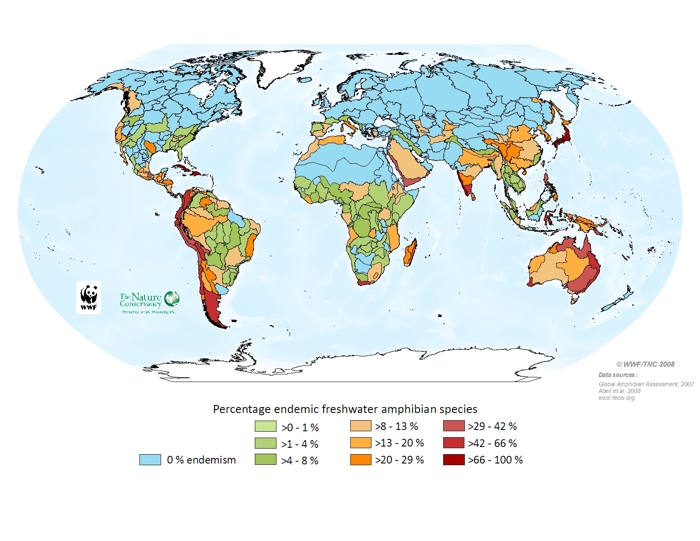
The map of number of percentage endemic freshwater amphibian species – the number of amphibian species present only in a given ecoregion divided by the total number of amphibian species present – was generated from the data gathered in the Global Amphibian Assessment (GAA) (IUCN, Conservation International, and NatureServe, 2006). The GAA assessed all 5,918 amphibian species described so far (http://www.globalamphibians.org/) and provided distribution maps for 5,640 of those species. The map presented here looked at the 4,035 species that depend on fresh water during some stage of their life cycle—it excludes strictly arboreal species that do not require freshwater for their larval stage, species that develop directly from eggs without a larval stage, as well as a few live-bearing species. The species distribution maps were used to determine the number of endemic amphibians per ecoregion. If at least 90% of a species’ range occurred in only one ecoregion, that species was said to be endemic. Some ecoregions with a long and narrow shape may have an overestimation of species given the way the range polygons were drawn. This is particularly true of the Amazonas High Andes ecoregion (312), where the mountain range has been used as a range boundary for hundreds of species.
Distribution maps from the GAA represent the Extent of Occurrence for each species— that is, the area contained within the shortest continuous imaginary boundary, which can be drawn to encompass all the known, inferred or projected sites of present occurrence of a taxon. A species\' distribution map can consist of more than one polygon where there is an obvious discontinuity in suitable habitat. Because of the conservative approach taken in the GAA to mapping species, the ranges for many species are likely to be minimum estimates. A rule was followed allowing interpolation of occurrence between known locations if the ecological conditions seem appropriate, but not permitting extrapolation beyond known locations. Some species are therefore almost certain to occur much more widely than has been mapped. Finally, the percentage of Data Deficient species (23.4%) is very high compared to other taxa. Please refer to the GAA for more detailed information on the data.