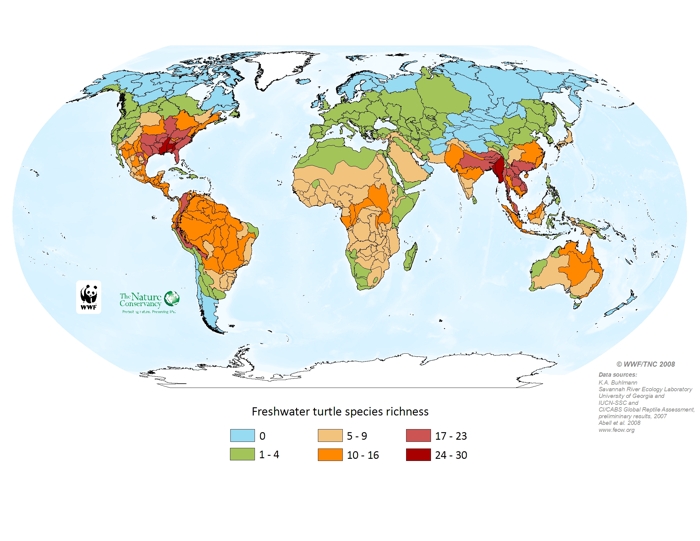
The map of freshwater turtle species richness – the number of species present in each ecoregion - was generated from species distribution maps provided by Dr. Kurt A. Buhlmann, the Savannah River Ecology Laboratory, the University of Georgia and the IUCN-SSC and CI/CABS Global Reptile Assessment (preliminary results). The original distribution maps represent coarse ranges of where species are thought to be present in the wild. The ranges have been updated with expert input to reflect areas where the species may have been extirpated from parts of the range; however they are not exact ranges. The amount of information available varies by species, with some species and regions better studied than others. In addition, many species names, especially in the tropics, actually represent complexes of several species that have not yet been disaggregated. The data provide an approximate geographic distribution map for 305 turtle species. Data were compiled from museum and literature records for the world’s tortoises and freshwater turtles. Verified locality points were correlated with GIS-defined hydrologic unit compartments (HUCs). Subsequently, \"projected\" distribution maps for each species were created by selecting additional HUCs that were representative of similar habitats, elevations, and physiographic regions as the HUCs with the verified point localities.
The species distribution maps were used to determine the number of turtles per ecoregion. When a range overlapped several ecoregions, species were counted as present in all those ecoregions that had part of the range. Some ecoregions with long and narrow shape may have an overestimation of species given the way the range polygons were drawn. This is particularly true for the Amazonas High Andes ecoregion (312), where the mountain range has been used as a range boundary for hundreds of species.